A few weeks ago, I wrote about how it would be best to implement a Regional Planning Model. In this article, I will sketch out a general pattern of how this could be implemented. Luckily, in many jurisdictions, the Metropolitan Planning Organization (MPO) also functions as the Council of Governments (COG). This means there is an existing structure that can be built upon already touches many local jurisdictions.

I’ll start with an example from California. This is because California already has regional planning structures statewide (for this example, we are setting aside the concern of the strength of these current agencies). I’ll give two examples, an urban setting and rural setting.


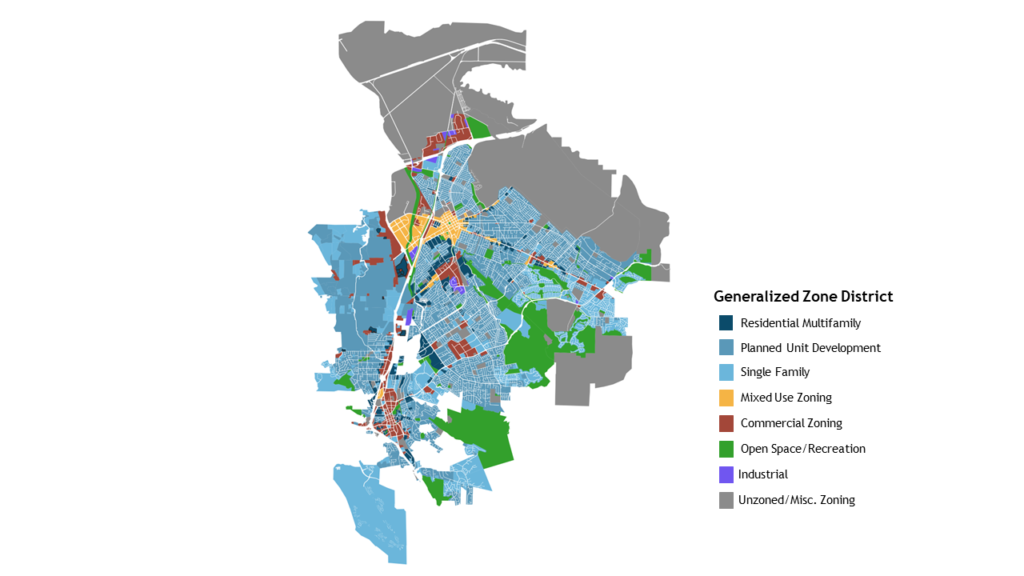
Urban Example: Association of Bay Area Governments (ABAG)

Source: Association of Bay Area Governments

ABAG is a fairly large COG, consisting of over 100 jurisdictions which represent more than 7 million individuals. Because it covers a number of major cities (San Jose, San Francisco, Oakland, Berkeley, etc.), it will require a complex internal reorganization to handle its new powers (land use and permitting). To that end, it will require satellite offices, spread throughout the jurisdiction. However, instead of having 100 different planning offices, many can be combined to have more inspectors/technicians per office and provide greater customer service. For example, an office located in Pittsburg or Antioch could service both cities as well as Brentwood, Oakley, and other jurisdictions. Similarly, an office in San Mateo could administer the upper peninsula. Moving day to day permits online would be critical to making the permitting process more customer friendly as well.

One consideration in planning/building permitting is that these offices should have one zoning administrator who is either a lawyer with land use experience or credentialed planner. Codes should also remove the planning commission in favor of zoning administrator hearings. This does two things. First, it moves the onus of planning back into a set the rules than administer them. Instead of pushing variances and use permits to make projects “ad hoc” decisions, the structure is set up to accomplish the normative goal of making sure rules are clear and making the permitting process an administrative task rather than a political task. Second, it speeds up the process by providing capacity to handle variances and other applications. Instead of spending time trying to wrangle a commission that may meet biweekly or bimonthly, there is a slate of administrators handling a general code which allows for applications to move faster. Appeals could be handled by a rotating board of COG member elected officials, but the board should meet no more than monthly and should be directing staff to bring forward changes if they receive lots of variance appeals. The point should be to create an internal framework which moves current planning to an administrative task.

Under this framework, long range planning would take a larger role. Long Range planning should strive to build consistency between the high level long range vision plans and the governing community/area plans and zoning code. Similar to the census, the long-range planning groups should strive to develop plans for identified “communities of interest” and monitoring and update these plans with frequency. This will result in a high number of area/community plans, which means a large staff to monitor and cycle through updates. However, the key would be to ensure that consistent zoning and land use designations are use to create a recognizable framework. This would also make it easy to deal with turnover in staff positions as there are more staff who will be familiar with the zoning and land use plans. This means that institutional knowledge is more likely to pass on, avoid planners trying to work against/rework plans as they come on board.


Rural Example: Shasta County

Source: County of Shasta

Rural and exurban communities are usually have fewer incorporated communities and have most of their land use and permitting done at a County level. Depending on the size of the County, they can function as their own COG and simply take back permitting and land use authority. These rural areas would have fewer offices (most likely one or two) and would likely be less changed by these reforms. In some cases, especially tourist areas that cross multiple County lines, it might be beneficial to examine whether a new COG should be established in order to address specific better align the planning authority with employment and economic activity.


Questions About Implementation

What about areas without a COG?

There are some areas with a small population that cannot support these activities. In these cases, there are a couple of options. One option is to have the state’s office of planning or equivalent to provide COG services. This could however be an issue that then creates an under served agency located in the capitol with no connection to the community. An alternative is to try to group these communities together and sponsor a new agency. A final option would be to accept that these communities will function differently and maintain the status quo. Neither of these options are ideal but all address the issue in some way

What about Multi-State Jurisdictions?

In some cases, COGs cross state lines as a result of the location of the metropolitan area. There is some precedence for multi-state agencies, either created at the federal level or through state agreements. Ideally, these jurisdictions should be created through acts of both state legislatures, with strong articles of incorporation (perhaps building on a COG’s existing charter). Funding and differences between states and their priorities will always be a tricky issue – for examples, look at Washington, DC’s transit system or the Tahoe Regional Planning Agency – but setting a strong foundation for the agency to look at the region as opposed to state boundaries can alleviate these concerns.


Additional Considerations

There are additional considerations that regionalization should push for as part of building better functioning service delivery and the best community use of space. This includes pushing for the consolidation of utility districts and service providers such as sewer, water and power providers. Differences between impact fees and standards related to development work against creating regional standards to enable development.

Another consideration is transparency in rules, requirements, and fees. Currently, the development process is convoluted, project specific, and fees are the remit of the respective agencies. The point of regionalization would be to have staff tasked with wrangling this process into a clear process with certainty. This would require both staff and IT solutions to provide public facing documents and tools that answer likely questions.

Funding is another consideration. While property taxes could be a source of funding for these agencies, some funding should come from permitting (keeping in mind that permits should be priced as to not price out development). Financing will be COG-specific but considerations of diverse funding streams should be important as to avoid having to make large staffing changes due to slow downs in development or the wider economy.

Finally, a large portion of this set up would be to avoid the current issues that plague the development process. Chief among these is the unequal method that current planning processes involve the community. Since generally only local property owners are notified of property applications, the mostly likely to be aware and participate in local hearings are homeowners. This leads to jurisdictions planning for no development through planning, regardless of what the general plan states. While states have cracked down on this behavior, moving planning to a regional level still addresses local needs while removing the temptation of local jurisdictions to not plan and share the housing burden.

While this change can alleviate process issues, it does not change the need for strong outreach when planning. Considering all residents, making sure to reach those who might not be available at typical meeting hours, and being aware of the variety of needs has to be part of the organization’s approach to planning. Allowing organizational “capture” by groups interested in selective outcomes would simply repeat the issues currently in place. Although a geographically diverse organization should be more resilient to pressure from special interest groups, it still requires an organizational culture that is based on meeting the future needs of all residents.


Regional planning could have a bright future in the United States. Our existing MPOs/COGs could be leveraged – especially in Urban Areas – to provide services and better utilize our land. As with everything, the devil is in the details, but there are opportunities for states to empower more regional thinking about the key issues of today (transit, housing, climate change) through the assignment of land use and permitting authority.

An idea that has been floating around planning circles for a long time is the concept of “Regionalization.” Put simply, that land use and governance should be administered regionally as opposed to being administered at the municipal or County level. There have been nods towards regional governance, but no full adoptees. Many populated areas have a Municipal Planning Organization (MPO) which oversees federal transportation dollars, a regional park/trail system, and often a Council of Governments exists to “coordinate action” amongst jurisdictions. We acknowledge that there is an interwoven connection between jurisdictions within a region but then return to our silos, leading to land uses which do not foster the diverse, dynamic communities we aspire to. As Karen Chapple puts it, “To plan for equitable and sustainable regions, we need to start from an understanding of how regional economies, economic opportunity, and family lives work today in each region around the world, and then link that to growth management planning.”[1]

Others have written more eloquently on the subject, but I will quickly go over what I believe to be the best arguments for Regional Planning.


Shared Revenue – Coordination as Opposed to Competition

The cornerstone of a regional approach is the sharing of revenue, the most famous being Minneapolis’ tax base sharing agreement (known as the Fiscal Disparities Program)[2]. By sharing a portion of revenue amongst jurisdictions to reduce fiscal disparities, it allows jurisdictions to worry less about scrimping and scrapping for funds.

Without this, jurisdictions are competing for tax revenue. On one side, this leads to cities cutting deals with businesses in the short term, or land use policies to make retail easier. Additionally, you get land use decisions aimed at maximizing revenue for a jurisdiction rather than trying to balance housing, economic development, equity, and environmental needs. Here is an example from my hometown and the two adjoining cities.

Source: Author

These cities (Concord, Pleasant Hill, and Walnut Creek), serve primarily as bedroom communities for the major East Bay employment centers (Oakland, Livermore, etc.). Despite this, the amount of land zoned for commercial uses is the same as the amount of land zoned for multifamily and mixed use uses combined (5.7% in both cases)[3]. I would argue that this represents a concern by land use officials to conserve land for sales tax revenue rather than a considered approach to community.

Tax sharing would not wholly solve this problem – even in the Minneapolis case, the local jurisdiction keeps a significant share of the revenue – but I believe it would curb the worst behavior we currently see in regions.


Aligning Transportation Policy with Land Use/Housing Policy

Currently, there is a spatial mismatch between transportation planning and land use planning across commute sheds. Currently, transit and transportation policy for a region is set by the MPO with input from transit districts and local jurisdictions. Since the MPO controls federal transportation dollars, they are the agencies that decide on investments in how people move about the region. While I do believe that there is a need for more centralization and coordination amongst transit agencies in regions as well as federal funding for transit; I do believe that the mismatch between transit planning and land use planning can make transit systems less effective than they could be. For example, low density zoning in transit rich areas lowers the number of potential riders, creating unprofitable routes. Conversely, sprawl and dispersed activity centers can strain a transit system and make service unreliable as agencies struggle to serve riders who are far out.

Furthermore, the MPO already at the correct level to address the commute shed. Here is the Bay Area’s

By bringing together your land use authority and transit service planning under one agency, a region would be able to better align transit services and multimodal transit investments with land use decisions. This promises more non-automotive trips, reduced vehicle miles traveled, better functioning transit systems, and savings as routes are aligned with density.


Improved Services

Additionally, moving to a regional approach would allow for better services. One difficulty for small scale builders is that processes and regulations vary between jurisdictions. This would allow small scale builders to “scale up” without having to worry about differences in regulations. Additionally, having permitting authority and land use at this geographic level will allow for more resources to be put into customer service and advance planning.

Examples of this include IT systems for processing building and entitlement permits. Currently, jurisdictions often use legacy systems without robust features which make permitting efficient and paperless. While this has improved, there are often still backlogs as review staff are overloaded. Ideally a regional permitting office would be able to staff with greater efficiency and provide applicants more assurance to work within multiple jurisdictions.

Additionally, a regional level would provide planning resources to currently underserved communities. Currently, there is a large imbalance between jurisdictions on planning. Some jurisdictions have their planning needs met by their local COG, have part-time state help, or hire contract planners, while richer/larger jurisdictions have entire departments to provide long-range planning and implementation. In this way, communities with non-local staff often have plans and ordinances which are patchwork and poorly implemented. By moving planning to a regional level, planners involved in the planning could be linked into the implementation of the plan, providing follow through on investments and projects laid out in their planning work.


I want to acknowledge that without changes to streamline housing development, increased funding for transit, and forward-looking policies to address pressing issues like environmental justice, unequal investment, and car-centric development standards; moving to a regional planning organization model would not yield the results needed to address the pressing issues we face. However, a regional model offers us the best opportunity to provide positive outcomes. At a regional scale, planners can align with the labor and commuting patterns of residents, helping to better shape growth in sustainable ways. They also can offer improve services to underserved communities; and help provide balance when areas do not contribute their fair share. Finally, from the perspective of good governance, regionalization improves transparency by providing more eyes, improves efficiency by removing middle management and expensive contractors, and provides more capacity to implement community goals and priorities. In my next essay, I will provide a hypothetical of how this could be implemented, looking at the State of California.


[1] Chapple, Karen. 2014. Planning Sustainable Cities and Regions: Towards More Equitable Development. New York: Taylor & Francis.

[2] Minnesota House Research Department. 2020. Minnesota’s Fiscal Disparities Programs. St. Paul, MN: Minnesota House of Representatives. https://www.house.leg.state.mn.us/hrd/pubs/fiscaldis.pdf.

[3] Based on analysis by the author, using public data from those governments

In 2018, California passed a rather progressive housing bill that did not get the attention that it should have. The bill, Senate Bill 2 and authored by Toni Atkins, is known as the Permanent Local Housing Allocation Act. Instead of affecting land use changes or entitlements, SB 2 created a new revenue stream. This revenue stream was a $75 fee on all recorded documents pertaining to the transfer and sale of real property. This is changes to a deed of trust (the document giving a named party control of a property) as well as other such documents. The money is then collected by the state and distributed to the jurisdiction in which the property is located. What this means is that high activity periods in the housing/property market will generate high sums for local jurisdictions to tap into.

To access these funds, jurisdictions are required to create a five-year plan for the use of these funds, similar to how entitlement jurisdictions are requited to create a Consolidated Plan for the Federal HOME Investment Partnership Program and Community Development Block Grant Program. What is different from these programs is that the PLHA program is geared towards the productions of new affordable housing. Jurisdictions can undertake one of ten activities:

  1. The predevelopment, development, acquisition, rehabilitation, and preservation of multifamily, residential live-work, rental housing that is affordable to extremely low-, very low-, low-, or moderate-income households, including necessary operating subsidies.
  2. The predevelopment, development, acquisition, rehabilitation, and preservation of Affordable rental and ownership housing, including Accessory Dwelling Units (ADUs), that meets the needs of a growing workforce earning up to 120-percent of AMI, or 150-percent of AMI in high-cost areas. ADUs.
  3. Matching portions of funds placed into Local or Regional Housing Trust Funds.
  4. Matching portions of funds available through the Low- and Moderate-Income Housing Asset Fund pursuant to subdivision (d) of HSC Section 34176.
  5. Capitalized Reserves for Services connected to the preservation and creation of new permanent supportive housing.
  6. Providing rapid rehousing, rental assistance and supportive/case management services that allow people to obtain and retain housing, operating and capital costs for navigation centers and emergency shelters, and the new construction, rehabilitation, and preservation of permanent and transitional housing.
  7. Accessibility modifications in lower-income owner-occupied housing.
  8. Efforts to acquire and rehabilitate foreclosed or vacant homes and apartments.
  9. Homeownership opportunities, including, but not limited to, down payment assistance.
  10. Fiscal incentives and or matching funds.

Unlike the larger CDBG program, PLHA is essentially an expanded state-funded HOME program. CDBG is the biggest housing related block grant program – however, eligible activities include community service and economic development activities in addition to housing activities. While there is nothing wrong with funding these activities, the fact that the production of housing has to compete with these other vital day-to day services means that funds do not go to housing production. Current HOME allocations – if the jurisdiction is HUD-designated under CDBG – typically are around $780,000 per year. While this, seems substantial, the reality is that the funds are quickly exhausted. For example, a typical 60-90 unit apartment costs can cost between $600,000 – $800,000 to obtain entitlements and begin the process before construction can begin ($6,667 – $13,333 per unit). This is not including other HOME activities such as down payment assistance, tenant rental assistance, and home rehabilitation. What PLHA does is bolster this funding source with state funds (and includes non-entitlement jurisdictions). Furthermore, PLHA offers flexibility to jurisdictions in how they go about getting housing built. This makes it easier for jurisdictions to fit PLHA funding into their planned housing strategies identified in their respective housing elements.


Creating a second funding stream for predevelopment has the effect of opening the pool of possible projects. There is often little funding to cover these predevelopment activities from traditional federal and state low-income funding sources. As such, projects may ‘stall out’. There might be interest in developing a property that the government or a nonprofit is interested in converting to housing. However, if there is no funding to do preconceptual drawings, architecture and engineering, market studies, traffic studies, and other necessary work before a construction loan is disbursed, then the project will not move forward. Most grant award programs such as the Affordable Housing and Sustainable Communities (AHSC) Program, or the Low Income Housing Tax Credit (LIHTC), are the ‘last’ step in the process. The goal of these programs is to fund the ‘gap’ that exists between current funding and the funding making the project feasible. Therefore, the programs are funding the construction of the unit, but not the predevelopment activities that allow you to construct the unit. By subsidizing predevelopment activities, some of these projects are able to wait for final funding longer, making their likelihood of development higher. That isn’t to say that all projects funded under PLHA will be successful, but it allows for more projects to be “in the pipeline”.

The PLHA program still does not fix the significant funding gaps that exist in affordable housing, which means that most funding programs have more projects than they have funding. However, it takes a huge step forward in help assist with the construction of affordable housing.

Since 2017, California has been pushing the development of ADUs as a means of alleviating the shortage of housing that currently exists in the State. Beyond allowing ADUs by right on almost all parcels[1], the State has also committed $100 million to help homeowners build ADUs[2]. While there are currently no details about this program, I would like to take the time to discuss another program which seeks to finance new ADUs, the CalHome program.

The CalHome program is the State’s own version of the federal HOME program. CalHome funds are applied for by local jurisdictions and nonprofits for one of the following activities[3]:

  • Loans to First-Time Homebuyers for Mortgage Assistance
  • Loans to owner-occupants for Rehabilitation
  • Provision of Technical Assistance to Self-Help housing projects
  • Provision of Technical Assistance for Shared Housing
  • Provision of CalHome program Loans to owner-occupants for new construction, repair, reconstruction, or rehabilitation of ADUs or JADUs

Like HOME funds, this gap financing is only allowed for homeowners and renters who meet the definition of a low-income household (80% of the median area income adjusted by family size). CalHome does have a Disaster Relief program (usually titled CalHome-DR) that does allow households making up to 120% of the area median income to participate in CalHome funded activities[4].

However, given that ADU construction only falls under the regular CalHome grant regulations, this means that only low-income households are currently eligible for ADU loans. However, this income group is unlikely to be able to take advantage of the program. To start with, many of these homeowners have a cost burden. An estimated 61% of households pay more than 30% of their monthly income towards their mortgage and other housing costs (HOA fees, etc.). Therefore, a significant are already unlikely to be able to support a second loan needed for construction.

Income CategoryOwnersShare of HouseholdsMonthly Housing Costs >30% of Income
Household Income <= 30% AMI509,41028%75%
Household Income >30% to <=50% AMI573,39037%63%
Household Income >50% to <=80% AMI925,24546%52%
Total <= 80% AMI2,008,04537%61%
Source: 2014-2018 CHAS Data, Assembled by the author, link: https://www.huduser.gov/portal/datasets/cp.html#2006-2017_query

A second issue is capital. Loans require some initial capital from the borrower. In the most optimistic scenario, a CalHome loan can cover half the cost (up to $100,000) of the cost of an ADU. For this scenario, let us assume that the cost of an ADU is roughly $160,000 (sourced from a survey of ADUs constructed in Portland[5]). The Borrower would be able to finance $80,000 through the CalHome program, but would require either A) $80,000 in savings/investments they could liquidate or B) a private loan. This would require some form of down payment. Given that it many households are unlikely to hold significant savings[6]; it is unlikely that many households would be able to provide the initial capital to start ADU projects.

What I believe the State should consider, in both the CalHome program and the future $100 million grant program, allowing moderate-income households (up to 120% AMI) to participate in the ADU program. First, moderate income households would be more likely to have the funds available to initialize ADU construction and benefit from these programs. Second, this would still fit within the core policy objective of providing affordable housing. Why? Consider the use of an ADU. A survey found that 60% of ADUs were used as either a rental unit (51%) or as multigenerational housing (9%)[7]. In both cases, these provide affordable housing. Multigenerational housing lowers the cost of housing elderly family members for the family or offspring while also allowing for separate living quarters. Anecdotally, building a house on the property after marriage was a rite of passage among my mother’s family in Detroit in the 1950s. Furthermore, the average rent in the survey was $1,298 for what are often either one to two bedroom units, making it affordable to those making around $52,000 ($25/hour). Considering that Alameda County (containing Berkeley and Oakland) a 1-person household making $76,000 is considered low income[8], the result would be a new “low-income” unit. One way to track this would be a require a yearly self-certification (for the period of the loan) that the borrower would complete stating who the occupant was (and if vacant, an attestation that the unit was planned to be used for a family member or rented out), current rent charged, and a copy of a lease (if applicable).

I want to stress that this should not replace investments by the state in promoting extremely low-income housing, particularly in areas of high opportunity. These require much deeper subsidies and should be a major priority. However, I believe the current ADU regulations are too restrictive, making the program unlikely to be a success. Easing the eligibility requirements could result in more housing built, which serves functional purposes, and produces affordable housing.


[1] David Garcia, “ADU Update: Early Lessons and Impacts of California’s State and Local Policy Changes,” Terner Center, 2017, 8.

[2] State of California, “Governor Newsom Signs Legislation to Increase Affordable Housing Supply and Strengthen Accountability, Highlights Comprehensive Strategy to Tackle Housing Crisis,” California Governor, September 28, 2021, https://www.gov.ca.gov/2021/09/28/governor-newsom-signs-legislation-to-increase-affordable-housing-supply-and-strengthen-accountability-highlights-comprehensive-strategy-to-tackle-housing-crisis/.

[3] California Department of Housing and Community Development, “CalHome Program Final Guidelines,” 2019, 51.

[4] California Department of Housing and Community Development.

[5] “Calculating the Costs of Accessory Dwelling Units | Building an ADU,” Building an ADU, accessed November 7, 2021, https://www.buildinganadu.com/cost-of-building-an-adu.

[6] The Federal Reserve Board of Governors in Washington DC., “Report on the Economic Well-Being of U.S. Households (SHED),” Board of Governors of the Federal Reserve System, accessed November 7, 2021, https://www.federalreserve.gov/publications/2020-economic-well-being-of-us-households-in-2019-dealing-with-unexpected-expenses.htm#:~:text=When%20faced%20with%20a%20hypothetical%20expense%20of%20%24400%2C,point%20increase%20from%202018%20%28%20figure%2014%20%29.

[7] Karen Chapple et al., “JUMPSTARTING THE MARKET FOR ACCESSORY DWELLING UNITS:,” UC Berkeley Previously Published Works, n.d., 30.

[8] California Department of Housing and Community Development, “State Income Limits for 2021,” California Code of Regulations, 2020, 13.

As if the Census Bureau had planned out their release schedule for maximum impact, the week David Card was awarded a the Nobel Prize in Economics, the Bureau published a new paper coauthored by Card, Jesse Rothstein, and Molses Yi, concerning migration and wage premiums. The paper uses two high quality US administrative data sets, the American Community Survey (ACS), and the Longitudinal Employer-Household Dynamics (LEHD). The authors use a variety of statistical methods to estimate increase or decrease in wages associated with a move, and specifically, what explains the “wage premium” associated with a move.

This paper exhibits some of the best practices of academic writing. Sentences are crisp and concise, the analysis and results are clearly explained, and the methods section is clear and approachable for a wide variety of audiences. I will let econometricians with greater knowledge discuss the methods employed, however, I will highlight the findings and discuss some of the implications and questions they raise from a practitioners perspective.


The first major takeaway is a probably the most plain, that industry premiums and location premiums are to a large extent separate. So for example, a banker’s wage in Waco TX, is likely to have a similar industry premium to a banker in New York, NY; but both will have different geographic premiums based on their location. This aligns with anecdotal evidence and even policies put in place by tech firms whose workers are choosing to move to lower cost cities.

The second takeaway is a surprising one. Card, Rothstein, and Yi find that although college educated individuals “sort” into high cost cities at a higher rate than those without a college education, this sorting doesn’t result in increased wages as a result of agglomeration and skills matching.

I think there are several reasons that this matching doesn’t result in increased wages. First, these “college education” industries likely have ‘national’ labor markets in which hiring can capture potential laborers from outside the Commuting Zone (CZ). This aligns with the first takeaway that shows that the industry premium and the geographic premium are separate. In essence, the additional pay an individual would receive as a result of their education and skills has already been “priced in” and being in a thicker labor market does not result in greater wages (or vice versa).

For local policy makers, this means that in some cases, trying to grow establish a clustered sector may not lead to greater returns, and that tax breaks or subsidies for companies could be a dicey proposition. Instead, this paper points to “economic gardening”, and building a diverse group of industries, as a more sustainable growth model. Furthermore, this might indicate the “placemaking” strategies which focus on building desirable communities might have a greater effect on migration than previously thought. As the authors note: “One potential explanation [of workers moving] is that large cities have even greater consumption amenity advantages than they do productivity advantages (Albouy 2011; Albouy, Cho, and Shappo 2021).” 

The final takeaway is fairly well known “truth” but does bear repeating; that significantly higher housing costs in the high wage and large metro regions eats up the location premium to workers. The authors note that any increases in wages gained by workers moving from Waco to New York will be lost as a result of the increased cost from housing. In fact, it was found that moving to a high cost location resulted in a loss in the real income of a worker.

There are a number of ways to interpret this. One interpretation is that employers have increased bargaining power in setting wages which means that they are able to negotiate a discount in exchange for allowing workers access to thicker labor markets. However, that seems counter indicated by the fact that the paper finds that the effect of a move is relatively symmetrical. A possible caveat to this is that national labor markets allows employers (particularly national employers) to limit gains in wages that might ordinarily result in high wage areas. There is some evidence that gains in productivity have not translated into gains in wages, but it is likely more evidence is needed.

Another interpretation is that this loss in real income is driven by land use policy. In essence, migration between areas will happen regardless of housing production, but the result will be that local economies will grow slower as disposable income is shifted towards housing costs. Instead, the land use policy drives gentrification and housing price gains in high wage areas. This would mean that high wage areas need to change their land use policies to increase housing to drive economic growth. A future research question might examine if areas that with lower housing costs relative to similar metro areas have higher rates of job growth and economic growth.


This paper also raises some interesting future questions. First, I think it is important to highlight the LEHD data is from employers. So the data does not capture self employed contractors (i.e. Uber drivers, Door Dash workers, and other app workers). This would be an interesting experiment to see if there is a similar wage premium for app employees across localities or if app companies are able to “flatten” that premium.

Another questions I have as a result of this paper is related to resource rich areas. The authors observe, ” There are some resource-intensive CZ’s (on the Texas Gulf Coast and in the Permian Basin, for example) that have relatively high CZ effects but only average earnings levels.” This to me signals that these areas actually are functioning as some sort of ‘transitional hub’ with income not ‘sticking’ in an area. However, the authors also note that resource areas in South Dakota are high wage areas. I would like to see further research on what processes might be causing these differences.

The final questions is related to the size of an area (in population) and its relation to wages. The authors find, “The ACS analysis indicates that skill is only weakly related to CZ size, explaining only 17% of the size effect on earnings, while the LEHD indicates a much stronger skill-size gradient, explaining nearly two-thirds of the total.” The authors seem to think this relates to the fact that a larger CZ has more educated workers scattered among different industries, but I am unsure why this would not show up similar in the ACS Data. Perhaps the LEHD data is using the 4-digit NAICS code? I would be interested in understanding this more.


Card, Rothstein, and Yi have put forward a really interesting paper that takes a clear step forward in applying statistical methods to pull apart increases in wages by industry and geography. for practitioners, it provides some significant evidence that placemaking and economic gardening strong economic development strategies. A diverse economy that provides high quality amenities will attract and retain workers rather than luring specific clusters through governmental incentives.

Additionally, in high wage regions, land use policy is possibly providing a drag on economic growth, as movers to the region are willing to spend significantly more on housing (that is to say, high housing costs are not affecting their decision to move). These regions should see building housing (of all types) as a priority.